Glassdome Glassdome

Insights

News 2024.10.10

Glassdome Joins MEMA: The Vehicle Suppliers Association to Accelerate Sustainability Compliance and Operational Efficiency

Glassdome's SaaS-based solution uses real data in real (or almost-real) time to understand and improve manufacturing processes

Vancouver, Wash.: Glassdome , a leading industrial software company, is helping build a greener, more resilient future for the vehicle supplier industry through membership in MEMA: The Vehicle Suppliers Association .

Glassdome will mark its arrival as a featured guest and sponsor in MEMA's Sustainability Hour podcast on October 28th, discussing the ever-stricter sustainability requirements of automakers like Stellantis and BMW .

MEMA represents the largest manufacturing sector in the United States, bringing together an industry responsible for 4.8 million jobs. It champions and advances the business interests of vehicle suppliers and the mobility industry, fostering a growing, profitable, innovative, and influential supplier industry.

Glassdome has already built a strong foothold in the automotive market. Automotive suppliers like LG Electronics and Lotte Infracell , manufacturers and service providers across the EV battery supply chain, and light automotive constructors all trust Glassdome's Continuous Improvement and Product Carbon Footprint (PCF) solutions.

The global auto industry aims to be carbon neutral by 2050. To fulfill that goal, many automakers are demanding that their suppliers calculate the PCF of their components, and get a third-party to verify that those numbers are accurate. Glassdome provides complete, consulting-backed support for carbon emission data collection, monitoring, and reporting throughout the manufacturing process for automotive suppliers like LG Electronics and Lotte Infracell.

Increased efficiency helps make that goal a reality. The Glassdome CI solution helps manufacturers see, understand, and solve their process inefficiencies in real time using real data pulled from the factory floor. The result is lower downtime, increased OEE, and better productivity.

In March, Glassdome achieved ISO 14067 certification from Lloyd's Register Quality Assurance , a global certification body. This streamlines the PCF verification process for customers by ensuring that the reports they create with Glassdome already match the highest international standards. 

Glassdome North American Director of Sustainability Brent Morin commented, “This is an incredible opportunity to bring together an industry dedicated to building up the American vehicle supplier industry with cutting-edge technology designed to help it respond to increasingly rigorous demands from automakers, governments, and consumers now and in the future.”

About Glassdome: Glassdome is an industrial software company with expertise in acquiring and analyzing data from manufacturing equipment. Glassdome's SaaS-based solution guides manufacturers from data collection to monitoring to ongoing reporting, enabling them to obtain data from machines, transfer it to software, and access it. The company empowers manufacturers within the EV battery, automotive, chemical, pharmaceutical, and food and beverage industries to capture the untapped potential of data throughout the supply chain to achieve continuous operational efficiency improvement and meet regulatory environmental and emissions compliance.

#PCF#carbon_emissions#제품탄소발자국
View More
슬라이드 이미지

Mfg 2024.10.09

How Continuous Improvement Helps Manufacturers Solve Staffing Challenges

America is facing a labor crisis, with an imminent shortage of up to 6 million workers. Manufacturing is particularly hard-hit.

The skilled industrial workforce is getting older. Younger generations are pursuing careers in service industries. Immigrants can backfill that gap to some degree, but require careful, time-intensive training. And once a worker is trained, they’re immediately vulnerable to being poached by a competitor.

Smart manufacturers are adapting. One of the best ways to alleviate staffing issues is to adopt Continuous Improvement (CI) processes and technology.

CI helps build factories with better visibility, culture, and process. All of which help you get the most out of the employees you have, and train the new ones that come in.

Better visibility

Continuous Improvement starts with being able to see what’s happening on your factory floor (That’s why Glassdome offers real-time visibility in our platform). Seeing a problem is the first step to fixing it.

One client example is in a confectionary factory. Our client’s quality control process involved a person responsible for randomly selecting chocolate cakes, measuring their dimensions with calipers, writing them down on a clipboard, and reporting the numbers back.

This employee didn’t directly contribute to increasing production, and if there was an out-of-tolerance cake, it would take hours (and hundreds of potentially poor quality cakes rolling through the line) before it was noticed and the fault was fixed.

Glassdome worked with the client to replace the calipers and clipboard with an automated system. Quality metrics improved, and the worker was assigned to a line that needed more manpower, solving two issues in one fix.

Another benefit of process visibility is enabling smart preventative maintenance. You can keep your process humming with a leaner staff with the ability to see small shifts in machine performance and codifying maintenance schedules and results. 

Fixing broken machines and dealing with fire drills takes more staff, on uneven hours, and adds hours and hours of downtime. Who needs that headache?

Process insight

CI demands a good map of your process, much the same way it works better with real-time machine and quality visibility. 

Visualizing and managing your processes helps you perfect your workflow, minimizing downtime and movement around the factory, and making sure the staff you have are directly impacting production at all times, instead of moving things around or waiting for other workers to finish their components.

Related methodologies like lean manufacturing and Kanban can help a lot in this effort.

Documenting and codifying processes also makes training a new employee easier. You can even use your data to bolster their training with AI.

It also means that one knowledgeable person leaving is less likely to cripple a department or process. Their knowledge is written down and ready for the next person to pick up and use.

Collaborative culture

CI is at its core a focus on incremental updates. Each day, every process can get optimized and streamlined. Instead of your staff waiting around for the next top-down revolution, they’re incentivized to find small ways to enhance their performance.

The emphasis on bottom-up improvement isn’t just about the day-to-day upgrades (although they certainly help). 

Feeling valuable and heard keeps staff motivated and engaged, reducing turnover. Delivering real, positive results, and being appropriately noticed and rewarded, fosters positive encouragement and open communication.

What next?

Staffing issues starting to bite hard? Or just trying to future-proof your factory? Glassdome can help.

Our Continuous Improvement platform has the real-time data visibility and customizable dashboards and reporting you’ll need to implement a durable, useful CI program. (And you can use it in combination with our Product Carbon Footprint solution to get greener while you get more efficient).

Get in touch today to learn more.

#manufacturing_operations#efficiency#AI
View More
슬라이드 이미지

PCF 2024.10.03

LCA vs. EPD vs. PCF: An Overview

Many companies began their sustainability journey with carefully selected numbers designed to make their products look as green as possible. The natural result was a mass backlash against greenwashing and a demand for rigorous standards for sustainability reporting.

Brands, corporations, and Original Equipment Manufacturers (OEMs) responded by publicly pledging carbon neutrality targets and putting internal policies in place to meet them.

But they have a problem. 80-90% of total emissions are categorized as Scope 3 - they're created in the supply chain, outside of their direct control. That has created a demand for transparency and product-level emission metrics.

This led to the emergence of a jumble of environmental designations; a web of governing bodies and acronyms that confuses as much as it clarifies. That's what we're here to help solve.

Today, three categories of reporting declarations are the leading global methods of reporting verified sustainability claims:

Life Cycle Assessment (LCA): A thorough “cradle-to-grave” study on comprehensive environmental impacts

Environmental Product Declaration (EPD): A document reporting the results of an LCA conducted according to specific, transparent rules called PCRs

Product Carbon Footprint (PCF): The quantified greenhouse gas emissions of a single product across a specific part of its lifecycle

So if you're a company that needs to declare your environmental impact, which standard is right for you?

LCA: Life Cycle Assessment

What is an LCA?

A Life Cycle Assessment is a comprehensive evaluation of the environmental impact of a product or service throughout its entire lifecycle.

As a “cradle-to-grave” assessment, it covers everything from raw material extraction, through manufacturing, transport, use, and disposal or recycling. 

It considers everything from upstream supplier data to downstream waste management. It also goes far beyond just carbon emissions, including things like water and land use and soil, air, and water pollution.

How do I create an LCA?

The four-part LCA process is codified by two international standards - ISO 14040 and ISO 14044

Step 1: Goal and Scope Definition
Clearly define the LCA's purpose, product or service being assessed, functional unit of measurement, and level of detail required. In simple terms, you're choosing the goal, use, audience, and level of review of the assessment.

Step 2: Life Cycle Inventory (LCI)
Compile the necessary data and analyze all of the relevant inputs and outputs. In the end, you should have a full list of everything that goes into and comes out of the product or service, environmentally speaking.

Step 3: Life Cycle Impact Assessment (LCIA)
Classify your resource use and emissions according to their potential environmental impacts. The scope you defined in step 1 will determine how many impact categories you'll need to use. In the end, you will have translated your inventory data into the metrics you need to complete the LCA.

Step 4: Interpretation
Turn your metrics into actionable insights. You need to determine the relative contributions and relevance of your impact sources, and review your data quality and limitations. Then, you can systematically look at ways to reduce your impact without just shifting the burden between phases of the product life cycle. Interpretation helps you use your findings to make smart decisions.

When is an LCA a good idea?

An LCA is comprehensive and somewhat flexible depending on the scope of the assessment, and it adheres to strict ISO standards for transparency and trust. 

If you want to know the full cradle-to-grave scope of a product or service's environmental impact beyond just emissions, it's probably the best tool. The flexibility in definition also means you can expand or contract the scope according to your needs.

It's useful for internal benchmarking, and for giving companies the trusted metrics they need to attract green capital.

When is an LCA a bad idea?

An LCA's inherent flexibility in scope definition means it suffers as an apples-to-apples comparison. What one company may consider comprehensive, another might consider unfinished.

Most LCAs have to rely on inputs from databases (Glassdome uses ecoInvent) for some of their data - that's completely normal. But if that secondary data becomes a large percentage of the data in your report, it can severely cut down on its accuracy.

A good LCA will also require a serious time and financial commitment. It is a complex, time-consuming, and data-intensive process that requires coordination up and down the supply chain. If you’re trying to nimbly respond to regulation or benchmark year-over-year, it might not be a great choice.

EPD: Environmental Product Declaration

What is an EPD?

An Environmental Product Declaration is a document that provides the quantified environmental data of a product based on a set of standards called Product Category Rules (PCRs).

An EPD is based on an LCA that is performed according to the criteria contained in the PCRs the company selects. Or, in less acronym-heavy terms, you assess your environmental impact according to certain rules that you choose, then write it down in a standardized document.

EPDs show the environmental performance of a product in a consistent, credible way and include a broad set of impacts, including carbon emissions, water usage, and air, soil, and water pollution.

The depth of an EPD is defined by the PCRs used. When two EPDs use the same PCRs, they provide a fair product-to-product comparison.

PCRs are based on the ISO 14025 standard and include criteria like:

  • Product category description
  • Goal of the included LCA
  • Functional and required units
  • System boundaries and cut-off criteria
  • Allocation rules
  • Environmental impact categories
  • Product use phase information
  • LCA calculation procedures
  • Data quality requirements
  • …and potentially even more

By so strictly defining each PCR, the standard helps ensure that EPDs are comparable to others within the same product category.

How do you create an EPD?

Creating an EPD is a four-step process, with the four-step LCA creation process nested inside it like a Russian matryoshka doll.

Screenshot 2024-09-27 163452.png

Step 1: Product and PCR Definition
Select and define the product you’re analyzing. Find a relevant available PCR, and, if one is not available, work with an expert to create one.

Step 2: Perform the LCA Study
See the section above. Collect your data into an LCI, perform your LCIA, interpret the results, and report following ISO 14040 guidelines.

Step 3: Write an EPD Report
Review your data quality and create your report following the ISO 14025 guidelines. Depending on your product and the PCRs you’ve chosen, other relevant standards could include ISO 14044 and ISO 21930.

Step 3: Verify and Publish Your EPD
Work with a third party to verify your EPD to ensure its credibility. Publish the EPD on a publicly accessible platform. The verification step is crucial to the EPD’s value as a comparison metric.

When is an EPD a good idea?

EPDs work very well in industries that demand transparency around cradle-to-grave environmental impact and have clear expectations about the PCRs used in the process. 

Good examples include green building rating systems like LEED, public procurement policies, and specific regulations that require detailed environmental disclosures. EPDs can help companies break into and stand out in competitive markets, and support their sustainable marketing claims.

When is an EPD a bad idea?

Since they include an LCA as part of the process, EPDs suffer from similar issues. They are time-consuming to create, can rely too much on averaged-out inputs from databases, and require a large investment of time and expertise.

Industries with fragmented sustainability reporting and no clear standard for PCRs break down the ability to compare EPDs to each other, severely limiting their usefulness.

If that’s the case for you, a good idea could be to work with industry associations to develop an industry standard before committing to an EPD.

PCF: Product Carbon Footprint

What is a PCF?

A Product Carbon Footprint is the sum of the total greenhouse gas emissions created by a product, expressed in CO2 equivalents (CO2e).

Depending on the scope of the study, a PCF can be “cradle-to-gate” (how much carbon was emitted in its production) or “cradle-to-grave” (how much carbon was emitted in its entire lifecycle, including use and disposal).

How do I create a PCF?

PCF is yet another four-step process, in this case codified in ISO 14040 and ISO 14067. It is similar to the LCA process, but only focuses on carbon emissions.

Step 1: Purpose Definition
Lay out why you’re calculating your PCF. Do you want to set an internal benchmark? Are you comparing against peers? Are you doing the study to comply with a customer’s requirements (like Stellantis in the auto industry)? By defining the purpose of your study, you can ensure that the study meets your needs.

Step 2: System Boundary Definition
Determine which processes and uses fall under the scope of this study. Will it be cradle-to-grave, cradle-to-gate, or just gate-to-gate (solely the carbon emissions created inside your factory)? Correctly allocating emissions across a supply chain is crucial to delivering an accurate final PCF.

Step 3: Data Collection
Gather production process and emissions data. For a more accurate final report, use primary data. Where primary data is missing or prohibitively hard to obtain, you can also use default data from databases that contain average emissions factors and modeling information.

Step 4: PCF Calculation
Multiply your activity data by the corresponding emissions factors for each stage in the system boundary. Now you have a baseline to reduce emissions and get more sustainable.

Step 5 (optional): Third-Party Verification
Get your PCF report verified by a third-party organization. You will almost certainly need to do this if you are using your PCF for regulatory compliance, and many manufacturers require verification by their suppliers as well.

When is a PCF a good idea?

Product Carbon Footprint is the only apples-to-apples comparative metric of product-level emissions. It is transparent, robust, and simple to understand. That's why automakers like Stellantis and BMW and regulations like the EU Battery Directive demand them.

While most other carbon footprint metrics only apply to the facility level (ie “how much carbon does my factory emit?”), PCF lets consumers see the impact of the exact product they're buying.

The tight focus on emissions also means it is easier to replicate, monitor, and report back on once the data pipeline is set up. That's especially true when you work with an ISO 14067-verified consulting and software solution like Glassdome.

When is a PCF a bad idea?

PCF is a powerful comparison and benchmarking tool for products. But it's not suitable for everything.

If you are trying to look at your total environmental impact, PCF doesn't cover it. It is strictly an emissions metric.

On the flip side, if all you are trying to do is tick a box for a less-demanding checklist sustainability, a cheaper carbon accounting software might do the trick.

How can I make my processes more sustainable?

Need to comply with government regulations, and show your customers or investors that you're getting greener by the day?

Our Product Carbon Footprint solution is the only real data solution that provides month-over-month updates on your emissions performance. Our consulting and software model, built by manufacturing experts, means you get a pipeline of primary data, and the support you need to interpret it and make improvements using our powerful Continuous Improvement tools . And our ISO 14067 certification means your report is verification-ready, cutting weeks or months out of the process.

Want to learn more? Get in touch . And after you've persevered through this explainer, we promise to keep the three-letter acronyms to a minimum.
 

#PCF#LCA#CO2emissions
View More
슬라이드 이미지

Mfg 2024.09.25

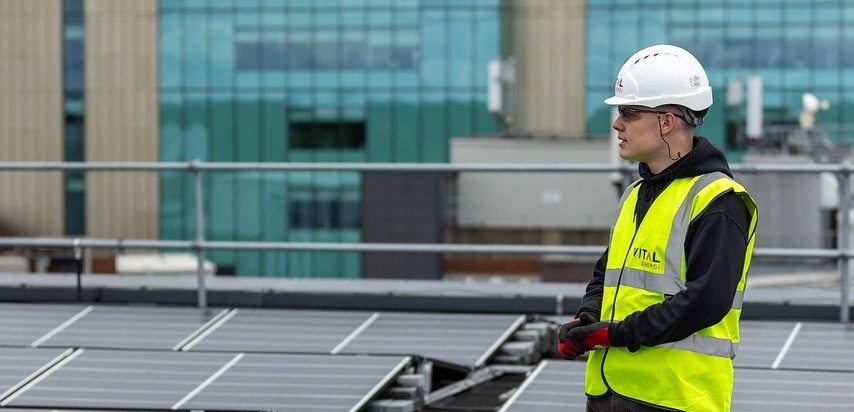
Why Operational Efficiency and Sustainability Aren’t Competing Interests
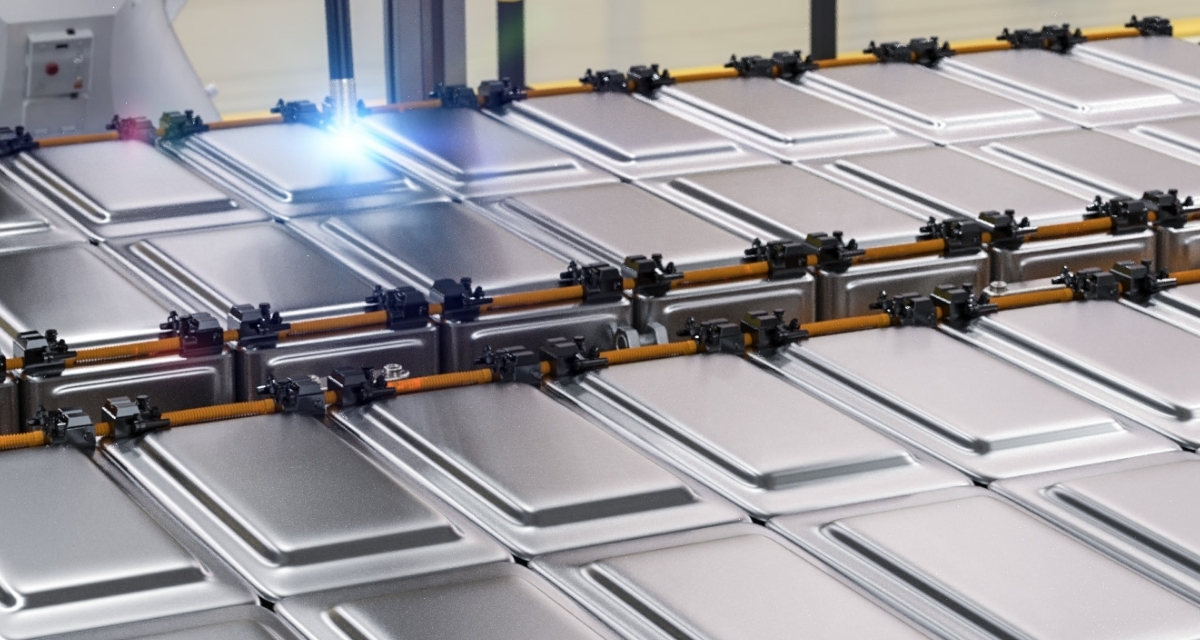
Making more money and making the world a better place are often framed as a tradeoff. 

But a better way to think about it is that production issues and carbon emissions are just different ways to measure inefficiency. When you work towards solving one metric, the other usually improves.

That’s why we offer Continuous Improvement and Product Carbon Footprint (PCF) solutions. Because they naturally work in sync.

Better performance uses less energy

Put simply, better performance leads to less waste. Less waste means each finished product takes less energy to produce.

Our Continuous Improvement software is usually used to improve three key metrics: better quality, less downtime, and faster problem solving.

Improved quality means less out-of-tolerance product is produced. When an out-of-tolerance end product is thrown out, the carbon price of its inputs is spread out through your good products, increasing their carbon footprint. When more of your inputs are going into products you can actually sell, the lower each of their individual PCFs will be.

Less downtime means your factory runs more efficiently. All that time your line is down, you’re still keeping the lights on and running other machines. Energy is a major component of a PCF. When your line runs efficiently, your energy input per product drops.

Faster problem solving can affect your PCF in a few ways. A shorter feedback loop means an issue on a line can be fixed before it has cranked out hundreds of poor quality products. Visibility into temperature fluctuations means you can quickly mend a loose oven cover - improving quality and reducing wasted energy. Shift-to-shift variation can be identified and rectified, with similarly green results.

This all also works in reverse. Each of these examples could be a key recommendation that emerges from a Product Carbon Footprint consulting engagement.

Same datasets, different calculations

The beautiful thing about the overlap between operational efficiency and sustainability is that they use very similar datasets.

Throughput, availability, and quality are the cornerstones of OEE, and they all impact the energy used to make a product. 

PCF’s laser focus on the inputs you use to make your product can be used as a forcing mechanism to find ways to decrease their amount and their cost. 

Once you have a functioning data pipeline from your factory floor to your manufacturing operations platform, the possibilities for what you can improve begin to look endless.

What’s this mean for me?

You can use sustainability goals to drive operational efficiency. Or vice versa.

And the overlap in datasets means if you have one data acquisition solution that can do both kinds of calculations, you’re in great shape.

Most customers come to us with a pressing need for either an operational or sustainability solution. But the symbiotic relationship between the two means it's easy to apply the other solution to the same factory or product. 

So why not handle both at the same time? Get carbon compliant and a lot more efficient, all at the same time. Set up a time to chat with one of our experts and we can see if it can work for your unique process.

#manufacturing_operations#efficiency
View More
슬라이드 이미지

Mfg 2024.09.23

How the 4M Method Can Improve Your Manufacturing Operations

Trying to find the root cause of production issues can be overwhelming. Modern manufacturing is a complex mechanism made up of elements that unpredictably impact each other. 

Many leading operations managers use the 4M Method to organize their challenges into discrete, solvable pieces. In doing so, they make prioritizing and solving those problems much simpler.

The 4M Method can also make implementing lean manufacturing concepts like Continuous Improvement much easier and more effective.

Ready to learn more, and find out what’s up with the fish in the image? Let’s dive in.

Origins of the 4M Method

The 4M Method, much like Continuous Improvement, has its roots in Japanese manufacturing and organization theory. 

Kaoru Ishikawa was a professor at Tokyo University who translated and taught the concepts of American management theorists like W. Edwards Deming (a founder of Continuous Improvement thinking) and Joseph Juran.

Ishikawa wanted to determine how to apply continuous improvement to processes when all variables are known. The result was the fishbone diagram (initially composed of 6Ms) shown below, out of which the 4M Method emerged.

Screenshot 2024-09-11 170037.png

What is the 4M Method?

The 4M Method is a way to identify and group the causes of a specific problem or effect in a manufacturing process. The four factors most manufacturers use are Manpower, Method, Material, and Machine.

Manpower

This M is about all things people - skills, operations, and resources. Common issues grouped under Man include: Lack of skills, missing qualifications, inadequate training, poor habits and behavior, and lack of motivation.

To apply the Manpower factor (yes, it sounds like a deodorant brand) to current performance, companies should:

  • Organize training opportunities to improve employees’ qualifications and skills.
  • Define the capabilities of each employee, identify their strengths and weaknesses, and ensure they are in the best position to succeed

To apply the Manpower factor to the future, companies should:

  • Rigorously define job goals and performance indicators
  • Invest in recruiting the best team members in both ability and attitude, whether through pay or other benefits

The ultimate question we need to answer is: Do my employees have the skill and the will to do what is expected of them safely, consistently and effectively?

Method

Method means the way you do things - processes, schedules, and procedures. Common issues grouped under Method include: Inadequate procedures, instructions, specifications, or responsibilities, incorrect process definitions, or not applying best production practices

To apply the Method factor to current performance, companies should:

  • Create a clear production strategy with public goals and metrics, and identify tasks that will help achieve those goals
  • Make sure each employee and department has tasks that match their skills and goals
  • Use a software solution for visibility, analysis, and informed decision making

To apply the Method factor to the future, companies should:

  • Review the percentage of errors (whether that is reflected in quality or production amount) when they apply their methods
  • Ensure their security is top-notch
  • Build charts and dashboard to track progress (Glassdome’s CI solution is great at creating custom dashboards)
  • Review instructions for machine operation, and place them where employees can easily review them

The ultimate question we need to answer is: Do I have the processes in place to produce my products consistently and safely?

One real life example: A Glassdome confectionary client measured quality by pulling snacks off of the conveyor belt by hand, measuring them with calipers, writing down the information, and handing the completed sheet to operations staff at the end of the day.

If there was a machine fault, hundreds of out-of-tolerance snacks could be produced before the problem was spotted and fixed.

By installing the Glassdome CI solution and automating the method with real-time data collection, the quality issues were dramatically reduced.

Once the Glassdome CI solution was installed, the quality control measurer was reassigned to manage machines.

In this case, a Method fix helped resolve Machine faults quickly, and optimized Manpower. The 4Ms are all interconnected.

Material

Material means the inputs in your process - information, raw materials and consumables. Common issues grouped under Material include: Poor quality of raw materials, defective components from suppliers, poor storage conditions, sourcing delays or excess

To apply the Material factor to current performance, companies should:

  • Rigorously review exactly how many materials they need in their production process
  • Check how materials and inventories are handled
  • Invest in technology that allows real-time review on quantities and conditions in warehouses

To apply the Material factor to the future, companies should:

  • Create or automate a process to check incoming material quality
  • Apply just-in-time manufacturing concepts to reduce the amount of raw materials and finished products that need to be stored for long periods of time
  • Develop a supplier management system to consistently re-evaluate the caliber of your suppliers

The ultimate question we need to answer is: Do my materials meet my needs? Are there no defects or shortages? Are they being handled or moved too much? Are they stored in the right conditions?

Machine

Machine is simple. It means the equipment you use to make your products. Common issues grouped under Machine include: Inadequate care, cleaning, and inspection, inadequate or aging machines, or poor installation

To apply the Machine factor to current performance, companies should:

  • Create a comprehensive maintenance plan that works with your production schedule
  • Implement software that helps you see and solve issues with machine maintenance and help you predict over- or under-use of your machines
  • Invest in modern machinery. It’s expensive, but just like trading in a creaky lemon for a new car it can be worth it over the long run

To apply the Machine factor to the future, companies should:

  • Review their maintenance schedules and results
  • Review how machines are arranged on the floor and how and when they’re used for maximum efficiency
  • Check that employees are properly assigned to machines based on their skills, and how many operators the machine needs

The ultimate question we need to answer is: Are my machines capable of sale and reliable output at the quality and rate I want? Are breakdowns, defects, or unplanned downtime getting in the way of that goal?

How can I use the 4M Method? And how can Glassdome help?

By prioritizing your issues through the 4M method, you can turn an ominous cloud of problems into a structured plan full of solutions. Making continuous improvement a lot more manageable.

Continuous Improvement is all about making big improvements over time through frequent small wins. It’s a natural fit with the 4M Method’s emphasis on prioritization and visibility.

It can start with a simple checklist like the one below.

Screenshot 2024-09-11 170128.png

Both methodologies only work to their highest potential if you can see and analyze what’s actually happening on your factory floor. That’s where Glassdome’s real-data-based Continuous Improvement solution comes in. By seeing real machine, shift, and production data in real time, you can make informed decisions that lead to big improvements.

You’ll cut downtime, increase quality, and solve problems faster. 

Sound appealing? Get in touch with one of Glassdome’s manufacturing experts to learn more.

#manufacturing_operations#manufacturing#factory_management
View More
슬라이드 이미지

News 2024.09.17

Glassdome and LG Electronics Launch Product Carbon Footprint Calculation and ISO 14067 Verification Project

Glassdome's SaaS-based solution will help LG Electronics use real-data-based metrics to simplify carbon verification and compliance

Vancouver, Wash. and Seoul, South Korea: Glassdome , a leading industrial software company, is proud to announce the launch of a new Product Carbon Footprint calculation and ISO 14067 verification project with the LG Electronics Vehicle component Solutions (VS) Company

LG VS Company develops and creates vehicle displays, connectivity solutions, and infotainment systems. It has also recently expanded into vehicle lighting systems and cybersecurity. LG's solutions are a key technology for the future of mobility as electric vehicles displace traditional powertrains around the world.

The global auto industry aims to be carbon neutral by 2050. To fulfill that goal, automakers are demanding that their suppliers calculate the Product Carbon Footprint (PCF) of their components, and get a third-party to verify that those numbers are accurate.

LG VS Company is making sure it stays compliant and competitive with the real-data-based Glassdome Product Carbon Footprint solution . Glassdome is a SaaS-based platform developed in accordance with ISO standards that derives real data from machines on the factory floor and securely integrates data from Tier 2 and 3 suppliers.

It provides complete, consulting-backed support for carbon emission data collection, monitoring, and reporting throughout the manufacturing process.

In March, Glassdome achieved ISO 14067 certification from Lloyd's Register Quality Assurance , a global certification body. This streamlines the PCF verification process for customers by ensuring that the reports they create with Glassdome already match the highest international standards. 

The Glassdome platform also speeds up the process by ensuring trust from the entire supply chain. Many of the required data inputs in PCF calculations could be used to derive sensitive data like component recipes and unit cost to produce. The Glassdome platform holds that data in a secure cloud, converts it into carbon emissions data, and only transmits those relevant outputs.

“The Glassdome solution solves carbon emission management issues facing global manufacturers as they respond to global regulations, and supports easy ESG transformation for companies,” commented Jinki Ham, Chief Business Officer of Glassdome. “Glassdome will help exporters strengthen their competitiveness in the market with our proven consulting and technology and fast and reliable third-party verification support.”

About Glassdome: Glassdome is an industrial software company with expertise in acquiring and analyzing data from manufacturing equipment. Glassdome's SaaS-based solution guides manufacturers from data collection to monitoring to ongoing reporting, enabling them to obtain data from machines, transfer it to software, and access it. The company empowers manufacturers within the EV battery, automotive, chemical, pharmaceutical, and food and beverage industries to capture the untapped potential of data throughout the supply chain to achieve continuous operational efficiency improvement and meet regulatory environmental and emissions compliance. 

For more information, contact John Wright, Director of Global Marketing, at [email protected].

#PCF#carbon_emissions#scope3
View More
슬라이드 이미지

PCF 2024.09.05

EU Battery Regulation: Timeline and System Boundary Requirements

EU Battery Regulation 2023/1542 is a gamechanger for battery makers importing to the EU and the companies they supply.

We’ve covered what these regulations mean for battery manufacturers in depth in a previous Insight.

In this Insight, we want to focus on the timeline. What do battery manufacturers need to act on for the near term, and what do they need to plan for in the long term?

EU Battery Regulation Overview

Before we start, let’s quickly review what EU Battery Regulation 2023/1542 entails:

Objective:
The EU Battery Regulation aims to ensure that batteries placed on the European market are sustainable and safe throughout their life cycle, covering all actors and their activities.

Who is impacted by the EU Battery Regulation?
The Regulation applies to any battery in the EU market with a capacity over 2kWh

What is required?
Article 7, together with Annex II, dictates required carbon footprints of electric vehicle batteries and rechargeable industrial batteries.

When does it start?
The regulation begins to come into force a year from the passage of its implementing act - likely sometime in 2025.

When do I need my Product Carbon Footprint? How about a digital battery passport?

Screenshot 2024-08-02 151627.pngYou need to start with a real-data-based Product Carbon Footprint.

The EU requires the carbon footprint of every EV battery sold in the EU be calculated and made publicly accessible by February 2025. Industrial batteries over 2kWh get an extra year - their deadline is in 2026.

The information in the footprint must be specific to each model and manufacturing plant and collected throughout the value chain. Any changes to materials or facility-level energy mix must be reflected, and carbon offsets cannot be included in the calculation. This will be used by the EU to help sort EV batteries into similar-performing types for easy identification in the future.

For the 2025 and 2026 deadlines, the Product Carbon Footprint just needs to include active material production. This system boundary, from raw materials to the finished product leaving the factory, is often called Cradle to Gate.

In the medium term, you’ll need to start engaging your suppliers and partners. In 2027, the system boundary requirements will expand to cover the four main stages of the battery life cycle:

  • Mineral extraction and pre-processing
  • Battery manufacturing (inclusive of active materials, cell manufacturing, and battery pack assembly)
  • Distribution
  • End-of-life processing and recycling

This full-lifecycle view is called Cradle to Grave.

Check out the infographics below for complete system boundary information.

For EV Batteries:

Screenshot 2024-08-02 151806.pngFor Industrial Batteries:

Screenshot 2024-08-02 151826.pngAlso in 2027, that data will need to be stored in a publicly available Digital Battery Passport. The idea behind the gap is to give companies time to iron out the process before the repercussions for failure get more serious.

(Already thinking about how much work that plant-level, real data-based PCF is going to be to calculate? Glassdome can help. Our PCF platform makes Battery Regulation compliance simple.)

Where should I start?

You should have all of the digital and organizational infrastructure in place to respond as soon as the implementing act is a go.

The most immediate need is a Product Carbon Footprint for each EV and industrial battery you produce. Then you can incorporate that PCF into a Digital Battery Passport.

Step 1: Calculate your PCF
As you can probably gather from the diagrams above, PCF calculation can be incredibly tedious and time-consuming. Setting your system boundaries, poring through dense databases, making sure you’re complying with reams of certification and legal regulations. Glassdome’s PCF solution helps manufacturers simplify PCF calculation and reporting.

Step 2: Verify your PCF
Not just any PCF report will do when you’re trying to comply with regulations. You need to create a report that complies with international standards to achieve your business needs. Glassdome’s PCF solution is ISO 14067 verified by LRQA. That means you’ll be able to get the PCF report you create with Glassdome verified quickly and easily compared to competitor solutions.

Step 3: Publish your PCF
Create a publicly available platform for regulators and customers to view your PCF. Our consultants can help ensure you’re complying with EU regulations.

Step 4: Create your Digital Battery Passport
With a compliant PCF in place, you have a couple of years to build the infrastructure of a digital battery passport for all of your battery models. Glassdome’s plant and product level data makes acquiring real data across multiple models a snap.

Want to learn more? Get in touch with a Glassdome sustainability expert today. Through our work with organizations like Samsung SDI, the Global Battery Alliance, and LG Electronics, we know how to help the world’s leading battery makers prepare for this regulation.

#sustainability#CO2emissions#GHG
View More
슬라이드 이미지

PCF 2024.08.22

What is the Global Battery Alliance Digital Battery Passport? (And How is Glassdome Involved?)

Glassdome exists to work with manufacturers to help build a more abundant future. Few projects exemplify our vision like the Global Battery Alliance Digital Battery Passport program.

The GBA was established at the World Economic Forum in 2017 through cooperation between battery producers, mining and energy companies, and government agencies. The Digital Battery Passport initiative helps it achieve its goal of a carbon neutral battery value chain by 2050.

Glassdome is leading a pilot program for the GBA. We’re bringing together 13 global companies and organizations to get ready for the EU Battery Directive’s implementation while advancing the GBA’s other goals.

How exactly does the project work, and how will it move both of our visions forward? Read on to find out.

The GBA Digital Battery Passport

The Digital Battery Passport is a system that tracks, manages, and provides access to full lifecycle and sustainability data for EV and industrial batteries over 2kWh distributed in the EU. To comply, battery manufacturers and suppliers need to collect and manage key data like their product carbon footprint (PCF), percentage of recycled materials, and country of origin.

The EU Battery Directive requires the implementation of a battery passport by February 2027. The EU requires that the battery passport contains:

  • A unique identifier
  • The type of model of the battery
  • Performance and durability statistics, updated over the battery’s lifecycle by those who repair or repurpose the battery

The GBA pilot program takes it a step further. The GBA passport, accessible via a QR code on the battery itself, will include:

Labeling data
Information necessary for identification of a specific battery and its components

Technical data
Technical parameters of a battery model and particular battery

Usage data
Information related to events during the battery’s use

Sustainability data
Sustainability performance expectations for the battery

Screenshot 2024-08-09 135745.png

What ESG indicators does the GBA Digital Battery Passport program cover?

The GBA goes several steps further than the EU when it comes to economic, social, and governance indicators.

The GBA Digital Battery Passport process will cover twenty one ESG indicators, whose frameworks are in varying degrees of completion.

Indicators marked in green have existing coverage in existing rulebooks or drafts.
Indicators marked in blue correspond to risk categories in the EU battery regulation due diligence chapter.
Indicators marked in black are remaining salient ESG issues.

Screenshot 2024-08-09 142612.png

What is Glassdome’s role?

Glassdome is project managing the pilot, storing the PCF data in our secure central hub, and helping companies in the pilot program navigate and learn from the initiative. We’re also acting as an expert guide that knows the details of battery passport regulation front-to-back. 

Wrangling data from thirteen companies and organizations involved isn't easy, but our background in secure data management and sustainability metric calculation for global enterprises make us well-suited for this role. 

The members of this program are:

How can Glassdome help your company?

Are you a battery manufacturer or supplier that needs to comply with the EU Battery Directive, or wants to get ready by joining in with the GBA pilot projects?

You’re going to need to start with a Product Carbon Footprint. Glassdome’s real data-based Product Carbon Footprint solution is made for manufacturers and suppliers. It simplifies carbon compliance, with integrated data aggregation and calculation and automated reporting.

Sound interesting? Get in touch and one of our experts can help you find the best climate compliance solution for your business.

#Global_Battery_Alliance#PCF#sustainability
View More
슬라이드 이미지

News 2024.06.03

Glassdome selected as organizer of new Global Battery Alliance Digital Battery Passport Pilot

Consortium of 13 companies, including Samsung SDI, SKIET, EcoPro, Lotte Infracell, and SK C&C, formed to respond to EU Battery Directive

Pilot project launched in May 2024 to establish systems, inspect companies’ regulatory response processes, and prepare for 2027 implementation of digital battery passport requirements

Vancouver, Wash., and Seoul, South Korea: Glassdome, a leading sustainability platform for manufacturers, was selected by the Global Battery Alliance (GBA) to organize a new Digital Battery Passport pilot project. The choice was revealed in an announcement on May 21, 2024. Glassdome has formed a consortium of 13 companies, including Samsung SDI, SK IE Technology (SKIET), EcoPro, and Lotte Infracell, and will lead a pilot program designed to preemptively respond to upcoming EU Battery Directive Digital Battery Passport requirements.

The Digital Battery Passport is a system that tracks, manages, and provides access to full lifecycle and sustainability data for EV and industrial batteries over 2kWh distributed in the EU. The EU Battery Directive requires its implementation by February 2027. To comply, battery manufacturers and suppliers need to collect and manage key data like their product carbon footprint (PCF), percentage of recycled materials, and country of origin.

The Glassdome platform helps companies report their PCF using real data. Carbon compliance and global environmental regulatory reporting are often a complex, time consuming process. Glassdome makes sustainability simple for manufacturers by guiding them from data collection to monitoring to ongoing reporting.

This year, Lloyd's Register Quality Assurance (LRQA) named Glassdome as the first ISO 14067 verified real data PCF platform. When a company measures and reports their PCF through Glassdome, its results already comply with ISO 14067 standards, shortening the verification period by weeks and cutting costs.

The GBA was established at the World Economic Forum in 2017 through cooperation between battery producers, mining and energy companies, and government agencies. The Digital Battery Passport initiative helps it achieve its goal of a carbon neutral battery value chain by 2050.

The GBA pilot project led by Glassdome will derive accurate real-data-based PCFs across the entire battery manufacturing lifecycle. It will also implement a secure data management system that helps manufacturers and partners share only their relevant PCF data, and only with those who need to know it.

The full consortium consists of:

Jinki Ham, CEO of Glassdome Korea, remarked, “As we transition from a linear to a circular economy, the global market needs environmental impact data. Sustainability regulation is changing the disclosure of information like recycling rates and product carbon footprint from a nice-to-have to a must-have.”

He continued, “Glassdome is a world leader in carbon regulation solutions. We’re dedicating ourselves to helping our manufacturing clients, large and small, continue to export to customers in Europe and anywhere else carbon regulation emerges.”

Lee Jeong-hoon, head of the SK C&C Net Zero Platform Business Team added, “Digital and ESG expertise based on LCA foundations is essential in tracking carbon data in the battery value chain. By combining that expertise with generative AI technology, we will go beyond simple data tracking and make our customers more competitive by helping them reduce their carbon footprints.”


Under Glassdome’s leadership, a total of 13 battery value chain companies from Korea, the U.S., and Australia will form the GBA consortium and promote the ‘Digital Battery Passport’ pilot project from May 2024.

About Glassdome: Glassdome is an industrial software company dedicated to making sustainability and operations clear and simple for manufacturers. The company was founded in the innovative heart of San Francisco in 2019. Roots in Silicon Valley and Korea connect a tech-savvy spirit with powerful industrial expertise. The Glassdome platform is uniquely positioned to serve manufacturers that want to improve efficiency and meet and exceed green regulation requirements, all in one platform.

Find out more at glassdome.com.

#Digital_Carbon_Passport#GlobalBatteryAlliance#PCF
View More
슬라이드 이미지
#PCF#scope3#LCA#ESG#CBAM#manufacturing_operations#Mfg_ops#AI