How does Product Carbon Footprint software work at Glassdome?
By Charlie Thompson
Product Carbon Footprint software is the heart of the Glassdome PCF solution. It helps global companies respond to regulation like CBAM and the EU Battery Regulation. But how does Product Carbon Footprint software work in practice?
Our software takes in all of the raw data generated by your company’s processes, and turns it into an accurate quantification of how much carbon is emitted per product. It’s a hard process to automate, reflected by the fact that we’re the first ISO 14067-verified cloud SaaS solution.
The PCF data integration process can be broadly divided into data collection and data processing, with a stop in the middle for data sorting into flows and unit processes:
- Data Collection
- Defining Flows & Unit Processes
- Data Processing
Once your data pipeline is set up, you’re ready to calculate the most accurate, granular Product Carbon Footprint in the business, create automated monthly reports, and comply with regulations like CBAM and the EU Battery Regulation.
Data Collection
We start answering the question of “how does product carbon footprint software work?” by collected all of the information we need. We collect data using three methods:
- Manual Data Collection
- MES / ERP Integration
- Gateway Connection
Manual Data Collection
Some data already exists on paper, but needs to be manually entered into the system. This includes monthly inputs and outputs that aren’t logged in the customer’s MES or ERP system or that can’t be collected by our gateways like waste, energy, and utilities data.
The customer provides this data to our PCF consulting team, which reports it to a data engineer. We validate and format the data, convert it to CSV, and upload it to the database. Customers can even request a CSV template and fill it out and upload it themselves.
The goal is to gradually reduce the amount of manual data entry, which is prone to human error, and replace it with as many automated data collection points as possible.
MES / ERP Integration
Legacy MES and ERP systems contain all kinds of useful inputs for PCF calculations. These include task histories, input, loss, and production amounts per task, and daily process inputs and outputs.
The Glassdome Production Monitoring system takes in many of these data points as well, as it also relies on our expertise in manufacturing data collection.
We use Airbyte to collect and help manage the data. When that connection doesn’t exist or isn’t robust enough, we can build a custom application.
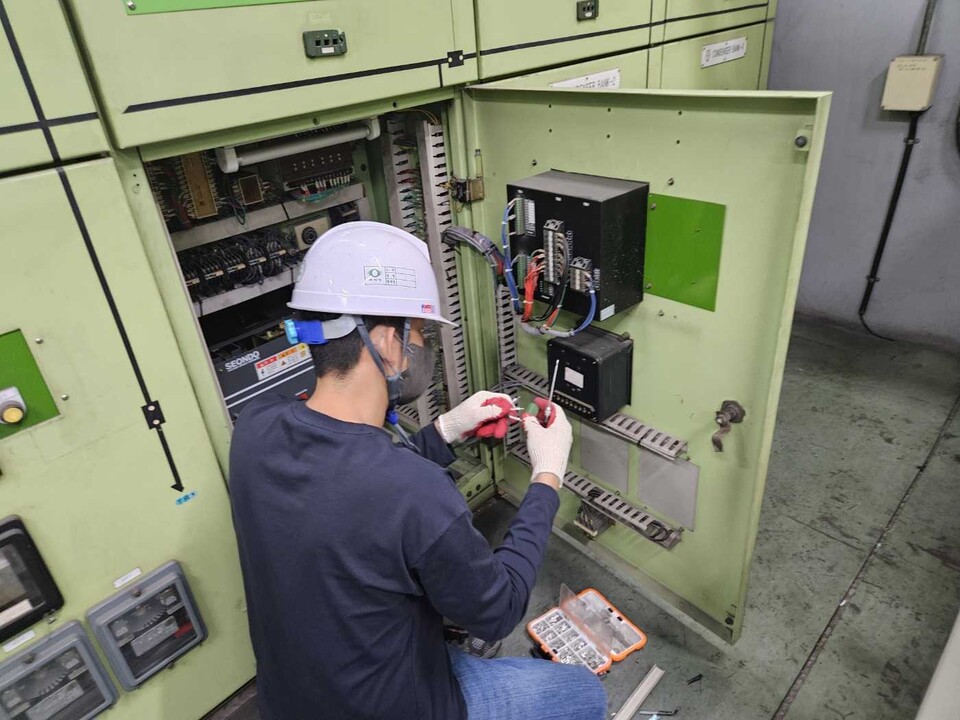
Gateway Connection
If you want the most accurate and granular primary data, you go right to the source. Glassdome can submeter electricity and production flows and automate the measurement of equipment input, loss, and production amounts. By connecting these sensors to our gateways, it allows customers to precisely assign emissions inputs to individual processes. We can even help identify the best data collection points for PCF data calculations and install them for you.
This data requires initial installation of electricity and flow meters, but results in an unparalleled look at your manufacturing process.
Defining Flows and Unit Processes
You have the data. Now what do you do with it?
To understand the data processing workflow, you first need to understand that the flows and unit processes defined in Glassdome often differ from those managed by customers.
Flows
All data first needs to be grouped into “flows” that define what kind of data it is, and where it is going in the production process.
Manufacturers typically record material purchases from suppliers and waste disposal quantities. For example, a customer might individually list six different types of purchased grease. In the PCF platform, these are grouped into a single flow, such as “Lubricant.”
Not every flow comes directly from customer data. For example, “Water Evaporation” may be added when the water input exceeds the output in a unit process.
Unit Processes
Unit processes are established by integrating or separating customer-managed equipment and processes.
Integration
Any identical customer processes or groups of equipment data that have been split up by other processes in between are brought back together into a single unit process.
Separation
If a single process produces multiple products, and flow allocation cannot be based on a simple production ratio, the process is divided into multiple unit processes.
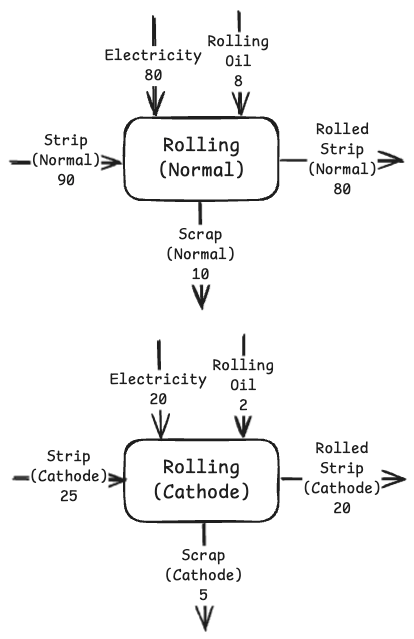
For example, in the rolling process, electricity and rolling oil are used commonly across both products. So, the amounts of the flows are allocated by 1:1 production ratio, that is, allocated by 4:1 (80:20).
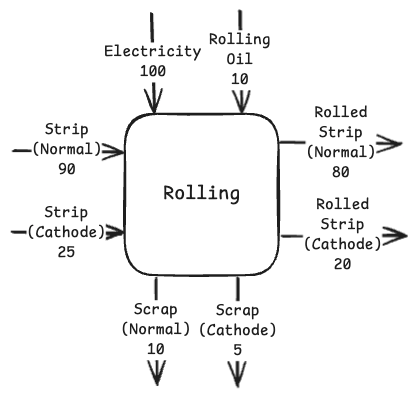
However, we can’t use a 1:1 production ratio for Strip(Normal), Strip(Cathode), Scrap(Normal), and Scrap(Cathode), because, for instance, Strip(Cathode) and Scrap(Cathode) are not an input or output for Rolled Strip(Normal). To correct this, the rolling process is split into “Rolling (Normal)” and “Rolling (Cathode)” unit processes.
Data Processing
All of the data has been collected and sorted into flows and unit processes. All that remains is to make it useful.
Data are processed using a third party data pipeline, primarily through:
- Processing flow input/output amounts into monthly data
- Mapping the monthly data to Glassdome-defined flows and unit processes
Processing Raw Data into Monthly Data
This stage converts raw data into monthly data based on flows and unit processes. The types of data we’re looking at include:
- Transport Data: Calculates transport amounts using purchased or disposed flow quantities and transport distances.
- Work History and Details: Aggregates input/loss/production data based on work history.
- Electricity/Flow Meter Data: Tracks changes in cumulative meter data to determine total consumption.
- Equipment Input/Loss/Production Amount: Tracks changes in input/loss/production amount data to determine total input/loss/production amounts.
Mapping the Monthly Data
Customer-defined flows, equipment, and processes are distributed and integrated into Glassdome-defined flows and unit processes.
Using our lubricants and aluminum rolling processes from before as an example:
- “Grease MOBIL GREASE XHP 462” is integrated to “Lubricants” flow
- Electricity consumption of “4H1 Rolling Mill” equipment is integrated to “Rolling & Annealing” unit process
- Flows used in “All Processes” are distributed to all unit processes based on production amount
- Flows used in cathode separation and normal annealing are distributed to “Separation(cathode)” and “Annealing(normal)” unit processes
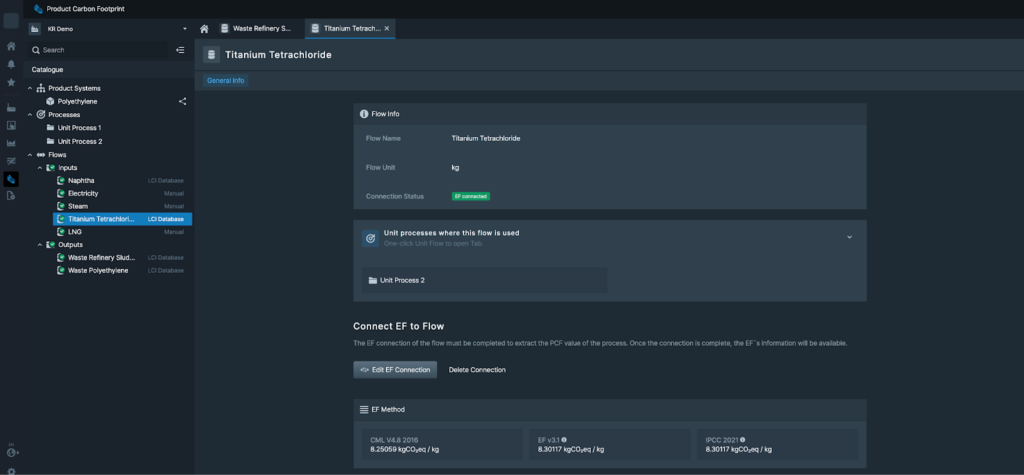
Reporting
With your data pipeline set up, we connect emission factors like the LCI database to each flow. Supplier PCF data is exchanged and integrated here as well.
Our software can then take all of those monthly inputs and automatically give you accurate, process-level reports that help you improve your emission performance.
Our consultants can also help you produce compliance-ready reports. ISO 14067 verification means that the data you get is ready to go for these use cases, dramatically streamlining the process and cutting down how long it takes you to comply.
Because “How does Product Carbon Footprint software work?” is only useful when you can answer “How can Product Carbon Footprint software help my business?”
Interested in a real life use case? Ask us about our partnership with Siemens and LG Electronics.
Ready to get started with Product Carbon Footprint?
Learn more about the only ISO 14067 verified software solution for your enterprise.