Carbon Accounting Software vs. Product Carbon Footprint Software: What’s the Difference?
By Charlie Thompson
Carbon accounting software is one of the fastest growing industries in the world, with companies like Persefoni and Watershed creating headlines and high valuations.
Potential customers often ask us the difference between those carbon accounting providers and our Product Carbon Footprint (PCF) solution. Don’t you all quantify and report carbon emissions?
Put simply, product carbon footprint is a highly specific and harder-to-calculate subset of carbon accounting. While most carbon accounting software solutions check the boxes at a corporate level, many regulations (like CBAM and the EU Battery Directive) and all product-level comparisons demand a PCF.
That’s why Glassdome has expert consultants to acquire real machine and factory data, build automated data pipelines, and set up our platform at an unparalleled level of granularity, along with month-over-month reporting.
Want to know more about carbon accounting and PCF software, and find out which solution your business needs? Keep reading.
What is carbon accounting?
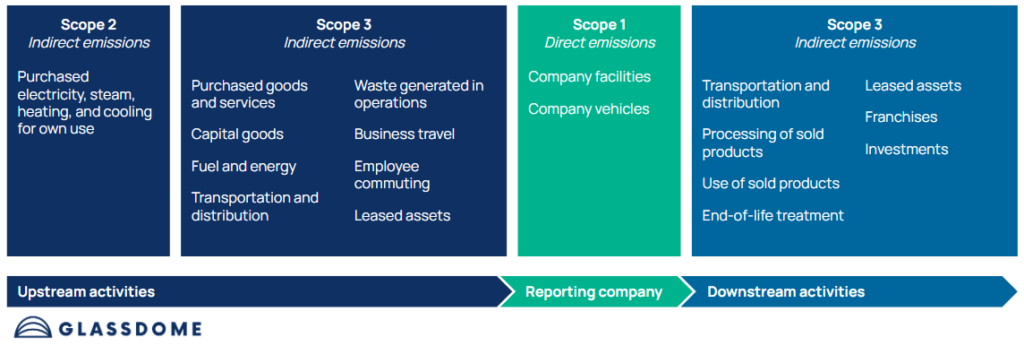
Carbon accounting (sometimes called greenhouse gas (GHG) accounting) is the calculation of how much greenhouse gas an organization emits within a set of boundaries.
Much like financial accounting, carbon accounting quantifies the impact of a business, just in carbon instead of dollars or euros.
Most carbon accounting software solutions only look at corporate carbon footprint (the carbon emitted by your business as a whole), and ideally package it in a way that makes it simple to report it to government agencies and other stakeholders.
How does carbon accounting work?
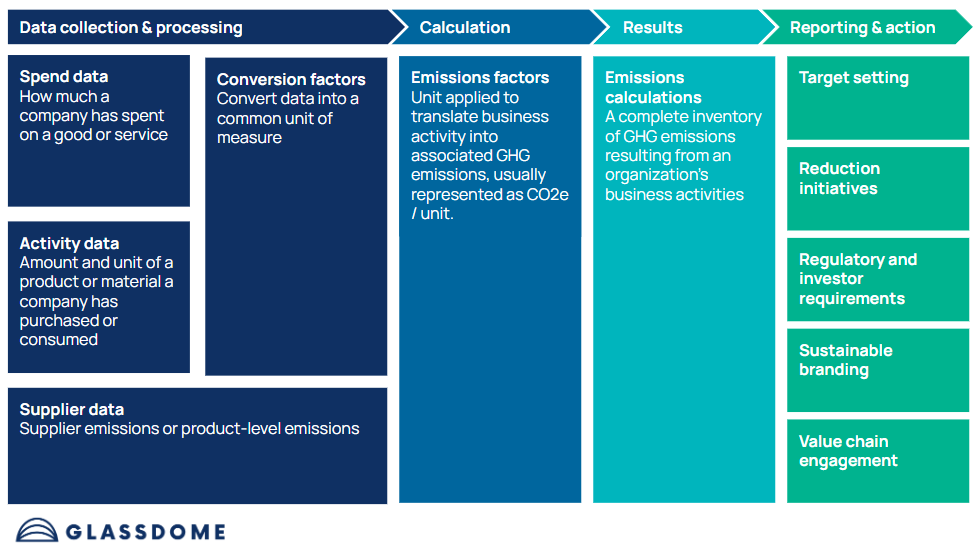
Carbon accounting is made up of two processes: data collection and data processing.
Data collection
Businesses first gather two pieces of data: spend data (how much money was paid to a provider of a good or service) and activity data (how much fuel and materials were bought by the company).
They also need to find the emissions factors associated with each unit of business data. An emissions factor codifies the amount of greenhouse gas emissions associated with each unit of business data.
Data processing
Data processing is the translation of raw spend and activity data into the corporate carbon footprint estimate.
There are three major methodologies used to estimate an organization’s GHG emissions: spend-based, activity-based, and hybrid (which combines both.
Spend-based method: In the spend-based GHG calculation method, the analyst takes the financial value of a purchased good or service and multiplies it by an emission factor.
These factors are derived from environmentally extended input-output (EEIO) models that map the flow of resources between economic sectors. Using them, analysts can calculate the average amount of emissions associated with each unit of currency paid to company in a determined industry and region.
As you can probably already tell, spend-based methods are based on industry averages and broad categories, with major gaps in accuracy and specificity. However, they are comparatively very easy to calculate.
Activity-based method: In the activity-based GHG calculation method, the analyst specifies how many units of a particular product or material the company has purchased, like fuel or plastics precursors.
Emissions factors are then applied to those units, much like the spend-based method. These factors are often derived from scientific studies.
Activity-based calculations are more accurate than ones using the spend-based method, but they’re also more time-consuming to gather.
Hybrid method: Most companies that use carbon accounting software use a hybrid model, which is recommended by the Greenhouse Gas Protocol. In this approach, the analyst uses all of the activity-based data possible, then fills in the gaps with spend-based estimates.
When is carbon accounting software right for my company?
A corporate carbon footprint derived using carbon accounting software is a great choice to meet reporting requirements like SBTi, the CDP, and CSRD. It can also help companies begin to develop reduction plans, set targets, and engage departments in broader climate goals.
It’s not a great choice if you want to know how much carbon goes into each product, if you want granular emissions data for informed decision making, or if you now or in the future need to comply with CBAM, the Digital Product Passport, or the EU Battery Regulation.
In brief, it’s an excellent first step on your sustainability journey, but tightening regulations mean your journey will likely need to continue onwards.
What’s a product carbon footprint?
A product carbon footprint (PCF) is the total greenhouse gas emissions produced by a product throughout its lifecycle. It is the only measure that lets you compare climate impact between similar products.
It is sometimes called product life cycle accounting or product life cycle assessment, but LCAs usually cover more impacts than just emissions.
How does product carbon footprint calculation work?
PCF Calculation is a four-step process.
Define the question
Determine the goal of your PCF before you start drawing up your approach. PCFs have flexible boundaries and methodologies depending on what you are trying to solve.
- Examples include:
- What are the biggest climate challenges in my supply chain?
- Does my product have a higher or lower climate impact than another product?
- What is the CBAM impact of my steel, aluminum, cement, fertilizer, or hydrogen based products? (Although it drives PCF software adoption, CBAM actually uses the same data but different methodologies of calculation – see the diagram below)
These questions are often driven by regulatory or customer demands.
Set the system boundary
System boundaries determine how much of a product’s lifecycle you’ll be analyzing.
Gate-to-gate: In gate-to-gate calculation, you only determine the carbon emissions associated with the product from processes in your facility. This will usually only be used if it’s a component of a supply chain, and the final product manufacturer is incorporating it into their PCF.
Cradle-to-gate: A cradle-to-gate calculation includes all of the GHG emissions associated with the product from the extraction of raw materials to the moment it leaves the factory gate. It is commonly used for intermediate products, where the final use is undetermined.
Cradle-to-grave: A cradle-to-grave calculation looks at the full lifecycle of product from raw materials to landfill, recycling, or reuse. It’s the most comprehensive set of boundaries, and the most widely-accepted one for final products.
Setting the boundary includes mapping out the production steps of the finished product, and establishing each process’ inputs and outputs.
A good look at standard system boundaries is below:

If a process creates more than one type of product, you’ll need to allocate its emissions between the products.
Collect the data
Much like carbon accounting, calculating a PCF requires business data and emissions factors. However, the business data required is far more granular to get down to the product level.
Most PCFs will use a form of the hybrid model from the carbon accounting section. If you’re reporting data for regulations and putting claims on your product packaging, you need to include as much accurate primary data as possible.
To determine an accurate PCF, you’ll start with primary data that you control: what you’ve purchased, what you’ve produced, what processes you used to produce those items, and any related emissions. Any PCF broader than gate-to-gate is also going to require supplier (and sometimes customer) data, accessed via a data exchange platform like SiGREEN.
It would be nice (and far more accurate) to be able to use primary data across the board. But most of the time that isn’t possible. You can then fill in the gaps with default data, which uses industry averages and modeling to fill in those gaps.
Ideally, you would only use default data as a stopgap while you set up your own pipeline of primary data (a tool like Glassdome that uses IoT gateways to pull data directly from your factory floor and offers consulting support to get it up and running is ideal).
Calculate the emissions
If all of the set up is handled correctly, the actual emissions calculation is a fairly simple set of arithmetic problems.
First, multiply every unit of activity by its emissions factor, creating a total emissions inventory.
Use the GHG Protocol’s guidelines to help allocate emissions of co-products and by-products.
Then, divide it by units produced to find the total carbon dioxide equivalent (CO2e) per unit produced.
And finally, split it up to find out the impact of each lifecycle stage.
The arithmetic is relatively simple. But all of the data collection, reporting, verification, and administration around it is a massive time investment.
When is product carbon footprint software right for my company?
A product carbon footprint solution is the right choice when you need to be able to confidently say how much carbon goes into each individual product.
Regulation, especially in the EU, is a major driver of PCF adoptions. The EU Battery Directive and CBAM are requiring many goods imported into the EU to include PCFs or calculations that involve similar primary data collection and calculation techniques.
Another use case is when you want to use your green credentials as a selling point for your products. Corporate carbon accounting software won’t hold up to scrutiny. PCF is the only measurement by which customers can directly and accurately compare the emissions impact of the products they’re considering.
It’s also useful when companies want an accurate, granular look at which parts of their value chain are creating the most emissions. For example, automotive OEMs (original equipment manufacturers) are asking suppliers for not only product-level emissions, but also a five-year emissions reduction strategy. The best starting point is to establish a baseline and work on the most emissions-intensive processes.
With a strong data pipeline, and the month-over-month reporting from a tool like the Glassdome Product Carbon Footprint solution, companies can calibrate their improvement initiatives for maximum impact and competitive advantage.
Is a real-data-based product carbon footprint right for your business?
Talk to a sustainability expert and find out